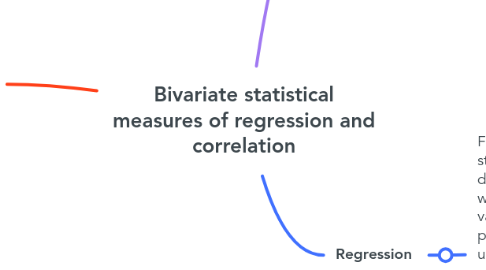
1. Regression
1.1. Frequently used in statistics, as it allows to derive an equation which relates a criterion variable to one or more predictor variables, the use of a single predictor variable practices the with simple regression analysis, and it comes to used or more is the multiple regression analysis.
1.1.1. Types of regression variables
1.1.1.1. Independent variables: is the one whose behavior or value is to be predicted or explained using the independent variables in a regression model.
1.1.1.2. Independent variables: have an effect on the dependent variable under study and are used to construct a predictive model.
1.1.2. Regression models
1.1.2.1. Simple linear regression: It is a statistical method which seeks to model the relationship between two variables: a dependent variable (Y) and an independent variable (X), assuming that this relationship can be approximated by a linear function.
1.1.2.2. Non-linear regression: Used to model the relationship between variables when this relationship does not conform to a linear function, this model can have a variety of functional forms, such as exponential, logarithmic, polynomial, sigmoidal or other more complex non-linear forms.
1.1.2.3. Multiple linear regression: It is a statistical technique which is intended to analyze why things happen or what are the main explanations of some phenomenon.
1.1.3. Types of regression
1.1.3.1. Regression type l: Assigns to each value of the explanatory variable the mean of the explained variable conditional on that value of the explanatory variable. Therefore, it will only provide estimates of Y for the values of X contained in the frequency distribution.
1.1.3.2. Regression type ll : When the type of function that relates the explanatory variable to the explained variable. Thus, the regression will be linear when such a function is a line, a plane or a hyperplane.
2. Bivariate statistical measures
2.1. Regression and correlation Scatterplot Simple linear regression Correlation Multiple regression
3. New node
4. Correlation
4.1. It is used in statistics as a technique which is used to measure the closeness of the linear relationship between two or more variables on an interval scale.
4.1.1. Degree of correlation
4.1.1.1. Strong correlation: a correlation is considered strong when there is a close linear relationship between the variables.
4.1.1.2. Weak correlation: is when the variables are less closely related to each other.
4.1.2. Types of correlation
4.1.2.1. Direct (positive) correlation: Refers to a relationship where both variables tend to move in the same direction. When one variable increases, the other also tends to increase. In numerical terms, it is represented by a correlation coefficient close to +1.
4.1.2.2. Inverse (negative) correlation: Refers to a relationship where variables tend to move in opposite directions. When one variable increases, the other tends to decrease. In numerical terms, it is represented by a correlation coefficient close to -1.
4.1.2.3. Null correlation: (absence of correlation): Refers to the lack of a linear relationship between two variables. In numerical terms, it is represented by a correlation coefficient close to 0. It indicates that there is no linear association between the variables, i.e., changes in one variable are not linearly related to changes in the other.
