1. Two types of forces in education perpetuate inequality
1.1. Primary Mechanisms = Social forces that create inequalities in education by affecting children's academic performance
1.1.1. The amount of family learning opportunities
1.1.1.1. My parents read to me as a child, they bought me a kid encyclopedia of different kinds of animals, and it became one of my favorite activities. My performance in school was increased because I enjoyed reading from an early age thanks to these efforts.
1.1.1.2. Depends on the family's situation: Can they afford books, courses, etc.? How much time do they have to spend with their kids, or do both parents have to work full time?
1.1.2. Stress
1.1.2.1. Extraordinarily turbulent home situations, for example. In class it was mentioned if a child spends the night in a shelter with their mom, they should not be penalized for not having their homework done!
1.1.3. Schools and Neighborhoods
1.1.3.1. Better schools with better teachers will make their students perform at a higher level!
1.2. Secondary Mechanisms = Social forces that create inequalities among students who have comparable academic performance
1.2.1. Cultural Mismatches
1.2.1.1. Schools are not culturally neutral! The things included and not included in curriculum sends a message about what is important.
1.2.1.2. Some students do not feel "at home" in our education culture. This means they are less motivated to work in that system, regardless of their ability.
1.2.2. Gender
1.2.2.1. Messages sent by our culture about what is appropriate to pursue for males and females
1.2.2.2. Different labor markets for men and women encourage or discourage higher education. Men may not need it as much to make a good wage, since they can much more easily work in the trades.
2. Causes of Inequality
2.1. Schools?
2.1.1. Schooling during fall and winter months reduces learning gaps between socioeconomic groups! But these gaps widen again when students are not in school
2.1.1.1. Schools compete with the powerful societal forces that create inequality. However, education is also a product of society, and in some ways perpetuates inequality.
2.1.1.1.1. An example of how education can feed into inequality is through teachers! "The School As An Informal System of Socialization" reminds that teachers are a product of society. Despite their best intentions they carry their own biases, and will treat children based on their assumptions. Some of their actions will perpetuate advantages to dominant groups.
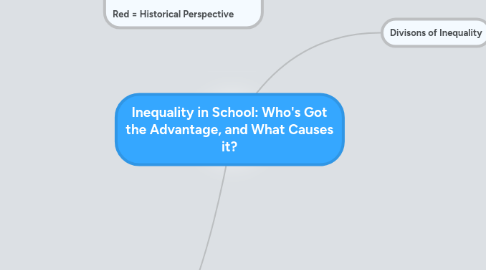
3. Green = Sociological Perspective Blue = Philosophical Perspective Red = Historical Perspective
4. aka Socioeconomic Status. This is a family's position on a gradient of cultural worth based on economic resources, parental education attainment, income and prestige of occupation.
5. Divisons of Inequality
5.1. Gender
5.1.1. In 1961, 25% of university graduates were women. But in 2006, women were shown to be attending university and graduating at greater rates than men.
5.1.1.1. Despite these improvements, some areas still lack equality between males and females.
5.1.1.1.1. Females are relatively rare in computer science and engineering.
5.1.1.1.2. Males are relatively rare in "feminine" professions like teaching and nursing.
5.1.1.2. Even in fields like Law and Medicine where equality is seen, females go into more "nurturing" specialties, while males go to more "high-powered" and lucrative specialties.
5.2. Race
5.2.1. Race is an artificial distinction between humans. It is created by culture, so different studies have divided race into different categories.
5.2.1.1. Used to be whites compared to visible minorities. AKA The Abella Image
5.2.1.2. Today it's seen as more complex. Researchers looked at % of Canadians between 25 and 34 with a university degree.
5.2.1.2.1. Aboriginal = 6.2%
5.2.1.2.2. Asian = 41%
5.2.1.2.3. Black = 18.3%
5.2.1.2.4. Hispanic = 18.8%
5.2.1.2.5. Other = 33.9%
5.2.1.2.6. White = 23.7%
5.3. Class
5.3.1. Disadvantaged youth are attaining greater levels of education. However advantaged youth have kept pace, so the opportunity gap remains.
5.3.1.1. Socioeconomic Status explains most differences between racial groups. Because of Canada's immigration policies, some races may appear to be superior, since only the most educated and wealthy can come to Canada. However studies show that as generations are born in Canada these differences diminish.
5.3.1.1.1. Aboriginals face unique disadvantages, even compared to other visible minorities.
