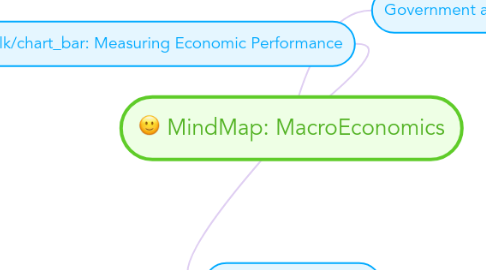
1. Measuring Economic Performance
1.1. Gross Domestic Product
1.1.1. GDP Defined
1.1.1.1. GDP Defined: The dollar value of all final goods and services produced within our borders in a given amount of time.
1.1.2. National Income Accounting
1.1.2.1. defined: system that collects statistics on individuals, businesses, and government
1.1.3. Expenditure vs. Income Approach
1.1.3.1. Expenditure: The amount spent by households, government, business +imports/exports on final goods/services; Income: The sum of all the incomes earned in the economy.
1.1.4. Intermediate vs. Final Goods
1.1.4.1. Intermediate: Goods used in the production of final goods; Final Goods: products in the form sold to consumers.
1.1.5. Durable vs. NonDurable Goods
1.1.5.1. Durable: goods that last a long time (appliances); NonDurable: goods that last a short time (food).
1.1.6. Nominal vs. Real GDP
1.1.6.1. Nominal: Measured in current dollars; Real: measure in constant prices (reason-for inflation)
1.1.7. Limitations on GDP
1.1.7.1. Nonmarket Activites
1.1.7.1.1. Caring for children/elderly
1.1.7.1.2. Mowing lawns
1.1.7.1.3. Washing cars
1.1.7.2. Underground Economy
1.1.7.2.1. Drugs
1.1.7.2.2. Weapons
1.1.7.2.3. Stolen Cars
1.1.7.2.4. Exotic Animals
1.1.7.3. Negative Externalities
1.1.7.3.1. Pollution
1.1.7.4. Quality of Life
1.1.7.4.1. Standard of living does not equal happiness (leisure time/safety)
1.1.8. Influences on GDP
1.1.8.1. Aggregate Supply
1.1.8.1.1. Aggregate Supply defined: total amount of goods and services that will be supplied at all price levels.
1.1.8.1.2. Price Level: the average of all prices in the economy
1.1.8.2. Aggregate Demand
1.1.8.2.1. Aggregate Demand define: amount of goods and services that will be purchased at all price levels.
1.2. Business Cycles
1.2.1. 4 phases
1.2.1.1. Expansion: Period of growth by a rise in real GDP
1.2.1.2. Peak: When real GDP stops rising.
1.2.1.3. Contraction: A period of declining real GDP.
1.2.1.3.1. Recession: Prolonged periods of contraction.
1.2.1.3.2. Depression: A severe or extended recession.
1.2.1.3.3. Stagflation: Decline in real GDP + Increase in Price Level
1.2.1.4. Trough: When real GDP stops declining.
1.2.2. 4 Influences on Business Cycle
1.2.2.1. Business Investment
1.2.2.1.1. + Investment = more jobs, more Aggregate Supply (AS)
1.2.2.1.2. - Investment = drop in Aggregate Demand (AD), fewer jobs
1.2.2.2. Interest Rates and Credit
1.2.2.2.1. Availability of credit depends on interest rates.
1.2.2.2.2. Low Interest Rates: Increased business investment and consumer demand.
1.2.2.2.3. High Interest Rates: Decreased business investment and consumer demand.
1.2.2.3. Consumer Expectations
1.2.2.3.1. Low expectations: More saving, less spending & investing.
1.2.2.3.2. High expectations: More spending and investing.
1.2.2.4. External Shocks
1.2.2.4.1. Negative: disruptions in oil supply, wars, poor trade relations, droughts
1.2.2.4.2. Positive: discovery of natural resources (ex: fracking), good weather,
1.3. Economic Growth
1.3.1. real GDP per capita
1.3.1.1. real GDP divided by the total population
1.3.2. Capital Deepening
1.3.2.1. increasing capital per worker. Ex: education (human capital); machines/roads (physical capital)
1.3.3. Savings & Investment
1.3.3.1. Savings rate: proportion of disposable income that is saved
1.3.4. Population Growth
1.3.4.1. Pop+Cap=Expansion
1.3.4.2. Pop-Cap=Contraction
1.3.5. Government
1.3.5.1. Example: Taxes
1.3.5.2. Infrastructure
1.3.5.3. Foreign Trade
1.3.6. Technology
1.3.6.1. Capital Based , ex: robots
1.3.6.1.1. Research, Patents, Scale, Education
1.3.6.2. Labor Based, ex: longer hours
1.4. Economic Challenges
1.4.1. Inflation
1.4.1.1. defined: a general increase in prices
1.4.1.2. price index: a measurement that shows how the average price of a standard group of goods changes over time.
1.4.1.2.1. CPI: Consumer Price Index- a market basket of goods that represent the typical urban consumer
1.4.1.2.2. S&P 500: a collection of stocks based on market caps that represent the largest companies being traded
1.4.1.2.3. Christmas Price Index
1.4.1.3. inflation rate: % change in price level over time
1.4.1.3.1. Inflation Rate=(Prices Year A 2015 - Prices Year B 2000)/Year B 2000*100
1.4.1.4. 3 Types of Inflation
1.4.1.4.1. Creeping: Inflation that remains low (1-3%) over a period of time.
1.4.1.4.2. Chronic: Inflation that rises steadily month after month.
1.4.1.4.3. Hyperinflation: Out of control inflation
1.4.1.5. 3 Causes of Inflation
1.4.1.5.1. Quantity Theory
1.4.1.5.2. Demand-Pull Theory
1.4.1.5.3. Cost-Push Theory
1.4.1.6. 3 Effects of Inflation
1.4.1.6.1. Purchasing Power: the ability to purchase goods/services declines.
1.4.1.6.2. Fixed Income: Those with the inability to increase their income see their income erode. Ex: Senior Citizens
1.4.1.6.3. Interest Rates: Inflation rates cut into investment/savings rates. Ex: Savings Account earns 5% but inflation rate is 3%, you really only earned 2% purchasing power.
1.4.2. Unemployment
1.4.2.1. 4 Types of Unemployment
1.4.2.1.1. Frictional: occurs when people take time to find a job (job loss, college grad)
1.4.2.1.2. Seasonal: occurs as a result of harvests, vacations, industry slow downs
1.4.2.1.3. structural: worker's skills don't match available jobs
1.4.2.1.4. Cyclical: increase unemployment during contraction, decrease unemployment during expansion
1.4.2.2. Measuring Unemployment
1.4.2.2.1. census: official count of the U.S population: About 50,000 families surveyed about employment status.
1.4.2.2.2. Labor Force: Civilians 16 years old and older actively looking for a job or holding a job.
1.4.2.2.3. Unemployment Rate: (Unemployed Workers / Labor Force) * 100.
1.4.2.2.4. Full Employment: level of employment when there is no cyclical unemployment: 4-6%
1.4.2.2.5. Underemployment: Working at a job for which one is over-qualified OR working part-time when seeking full-time employment.
1.4.2.2.6. Discouraged Workers: a person who wants a job but has given up looking. NOT counted in unemployment rate.
1.4.3. Poverty
2. The Global Economy
2.1. International Trade
2.2. Economic Development and Transition
3. Government and the Economy
3.1. Taxes & Government Spending
3.1.1. Federal Taxes
3.1.2. Federal Spending
3.1.3. State/Local Taxes & Spending
3.2. Fiscal Policy
3.2.1. The National Debt & Deficit
3.2.2. Fiscal Policy Options
3.3. Monetary Policy
3.3.1. Monetary Policy Tools
3.3.2. Macroeconomic Stabilization
3.3.3. The Federal Reserve System
