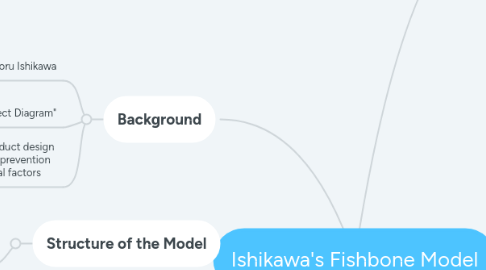
1. Background
1.1. Developed by Kaoru Ishikawa
1.2. Also known as "Cause-and-Effect Diagram"
1.3. Widely used in product design and quality defect prevention to identify potential factors
2. Structure of the Model
2.1. Diagram resembles a fish skeleton
2.1.1. "Head": Represents the effect or problem
2.1.2. "Spine": Links causes to the effect
2.1.3. "Bones": Represent different cause categories
3. How to Use the Model
3.1. Defining the problem or effect
3.2. Identifying the main causes
3.3. Identifying secondary and tertiary causes
3.4. Developing corrective actions based on identified causes
4. Purpose of the Model
4.1. Root Cause Analysis
4.1.1. Identify source of a problem
4.1.2. Determine interdependencies among causes
4.2. Quality Control
4.2.1. Establish what conditions need to be fulfilled to reach a quality result
4.2.2. Assist in the process of designing and redesigning product processes
5. Common Cause Categories (4M, 8P, E-M)
5.1. 4M
5.1.1. Man - workforce involved in the process
5.1.2. Machine - tools, technology used in the process
5.1.3. Method - process steps, techniques, order of events
5.1.4. Many - environment where the process takes place
5.2. 8P
5.2.1. Product - the output, what is being produced
5.2.2. Price - cost related factors
5.2.3. Place - location of process/production
5.2.4. Promotion - advertising and promotion related aspects
5.2.5. People - personnel involved in the process
5.2.6. Processes - steps and procedures
5.2.7. Policies - rules, regulations, governance
5.2.8. Procedures - detailed process steps
5.3. E-M
5.3.1. Equipment - tools, machinery, facilities
5.3.2. Material - resources, inputs to the process
6. Example of Use
6.1. Problem: Low Productivity
6.1.1. Potential Causes
6.1.1.1. Equipment
6.1.1.1.1. Machine malfunctions
6.1.1.1.2. Inadequate tools
6.1.1.2. People
6.1.1.2.1. Poor training
6.1.1.2.2. Lack of motivation
6.1.1.3. Procedures
6.1.1.3.1. Too complicated
6.1.1.3.2. Not clearly defined
