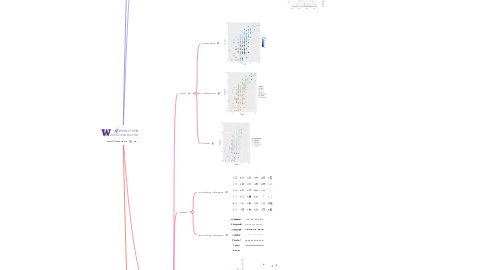
1. Objects / Marks / Geometries
1.1. **DOTS**
1.2. LINES
1.3. POLYGONS / CIRCLES
2. Plot Components
2.1. Title
2.1.1. Main: "The title is the answer"
2.1.2. Sub: Just for the specifics (place, time, etc)
2.2. Axes
2.2.1. Includes Zero?
2.2.1.1. Always in bars
2.2.1.2. May be optional in lines
2.2.2. Units of measurement
2.2.3. annotations might make them irrelevant
2.2.3.1. benefit data-to-ink ratio
2.3. Caption
2.3.1. Source: cite!
2.3.2. Some technical notes
2.3.2.1. for example:
2.4. Annotations
2.4.1. not for all values
2.4.2. a tool for focus
2.4.3. can be
2.4.3.1. text
2.4.3.2. line
2.4.3.3. rectangle
2.4.3.4. picture
2.5. Background
2.5.1. Grid
2.5.1.1. complexity
2.5.2. Margins
2.5.2.1. flexibility
2.6. Legend
2.6.1. helps
2.6.2. not much help
3. encoding
3.1. color
3.1.1. quantities
3.1.2. categories
3.1.3. levels
3.2. shape
3.2.1. encoding: category
3.2.2. encoding: category
3.3. position
3.3.1. variables relationship
3.3.2. a spatial location
3.4. Length
3.5. Trend
3.6. Angles
3.7. Connections
3.8. count
3.8.1. density
3.9. proportion
3.9.1. radius/area
3.10. others
3.10.1. thickness
3.10.2. transparency
3.10.3. density
4. Plotting by data type
4.1. One Variable
4.1.1. Barplot
4.1.1.1. categorical only
4.1.1.1.1. categories can be reordered only for nominal data
4.1.2. Histogram
4.1.2.1. Numercial only
4.1.3. Boxplot
4.1.3.1. Good for categorical - **iff** ordinal
4.1.3.2. Good for numerical
4.2. Two Variables
4.2.1. Scatterplot
4.2.1.1. two numerical
4.2.2. dodged barplot
4.2.2.1. two categorical
4.2.3. stacked barplot
4.2.3.1. two categorical
4.2.4. splitted plots
4.2.4.1. one numerical + one categorical
4.2.5. line plot
4.2.5.1. numerical and dates
4.3. More than two variables
4.3.1. need for dimensionality reduction
4.3.2. facetting
